Note
Go to the end to download the full example code.
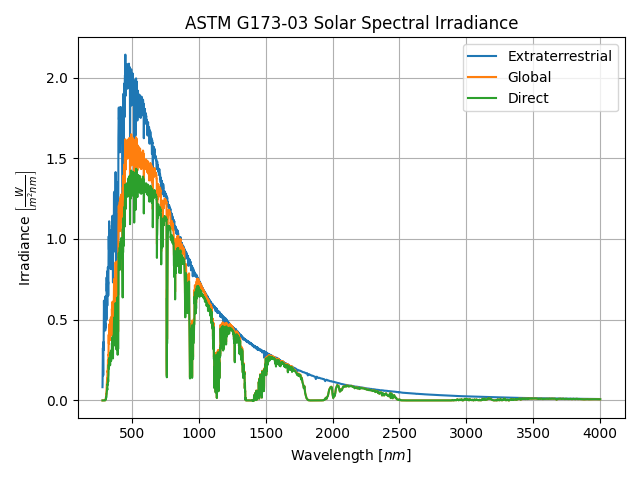
ASTM G173-03 Standard Spectrum#
This example demonstrates how to read the data from the ASTM G173-03 standard spectrum bundled with pvlib and plot each of the components.
The ASTM G173-03 standard provides reference solar spectral irradiance data.
import matplotlib.pyplot as plt
import pvlib
Use pvlib.spectrum.get_reference_spectra() to read a spectra dataset
bundled with pvlib.
am15 = pvlib.spectrum.get_reference_spectra(standard="ASTM G173-03")

# Plot
plt.plot(am15.index, am15["extraterrestrial"], label="Extraterrestrial")
plt.plot(am15.index, am15["global"], label="Global")
plt.plot(am15.index, am15["direct"], label="Direct")
plt.xlabel(r"Wavelength $[nm]$")
plt.ylabel(r"Irradiance $\left[\frac{W}{m^2 nm}\right]$")
plt.title("ASTM G173-03 Solar Spectral Irradiance")
plt.legend()
plt.grid(True)
plt.tight_layout()
plt.show()
Total running time of the script: (0 minutes 0.086 seconds)